Project QC Report Page
Table of Contents
Overview
QC report pages are designed to combine matrices from sequencing raw data as well as primary alignment and analysis runs. Download links of raw data files (fastq and cram) are not available from this page. Please check the Data access page for more details about accessing these QC pages from our ftp site.
Project home
This page provides a top level overview of the data availability for the project and lists required links for individual sequencing runs, project status description and analysis report page. Project home page has three different sections
- Raw data: Information about project data overview
- Status: Status of project tracking
- Analysis: List analysis reports per sample
Project data overview
This page shows availability of raw data for the project. It has following two sections
- Sequencing runs: List of flowcell ids (sequencing runs)
- Sample stats: Plot for combined data availability (read count per sample)
Navigate to project data page
You can reach this page from any of the run level or sample level pages by clicking the ‘Project Home’ from top navigation menu.
Alternatively, you can Click on ‘Project Home’ from the top navigation menu
or select the ‘Raw data’ option from the left side panel, if you are in the project status or analysis report page.
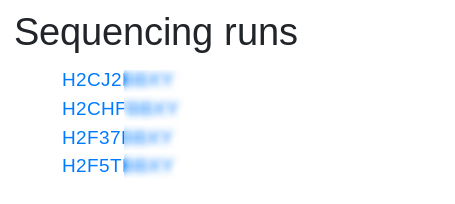
List of sequencing runs
This section of the project home page lists the flowcell barcodes of individual sequencing runs. These ids are linked to the run level pages with detailed QC information of each specific runs.
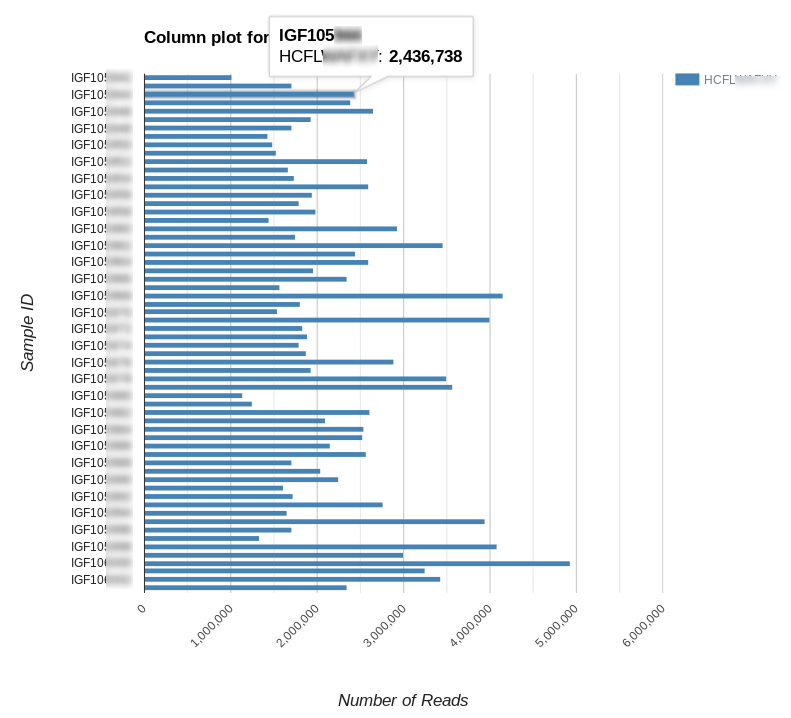
Project with single sequencing run (column plot)
This section of the ‘Raw data’ page shows read counts available for individual samples from a single sequencing run. This plot is useful if you have only few samples and all of them have almost similar number of reads. The default mode for column plot is linear scale. Its possible to change the scale to log using the ‘Column plot - Log’ button.
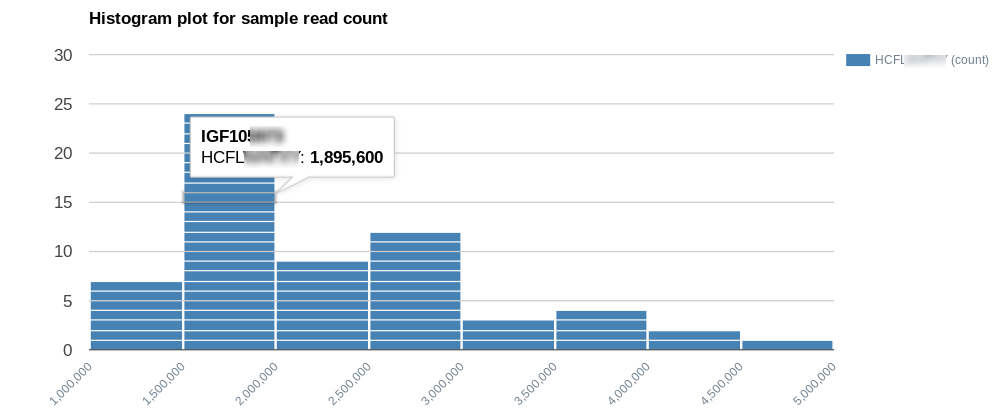
Project with single sequencing run (histogram plot)
Click on the ‘Histogram plot’ button for generating a histogram plot of sample read counts. This plot is useful for inspection if you have many samples with a range of read count distribution.
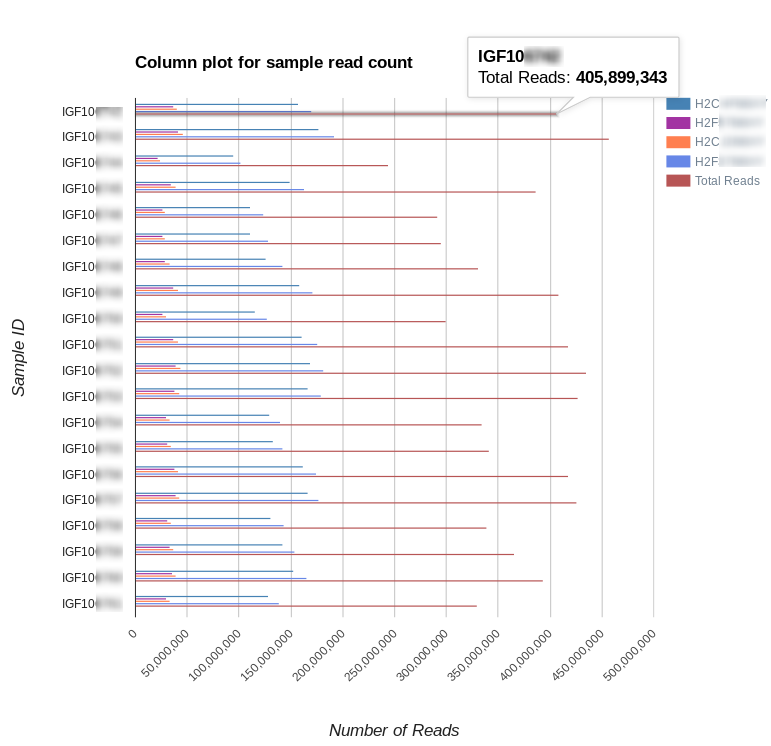
Project with multiple sequencing runs (column plot)
This plot is similar to Project with single sequencing run (column plot) with one key difference. This view combines the read counts per samples grouped by individual sequencing runs. A separate data point ‘Total Reads’ is added if any sample is sequenced in more than one flowcell. This plot is useful for checking the raw data, if your project have more than one sequencing runs and very few of the samples are repeated in more than one run.
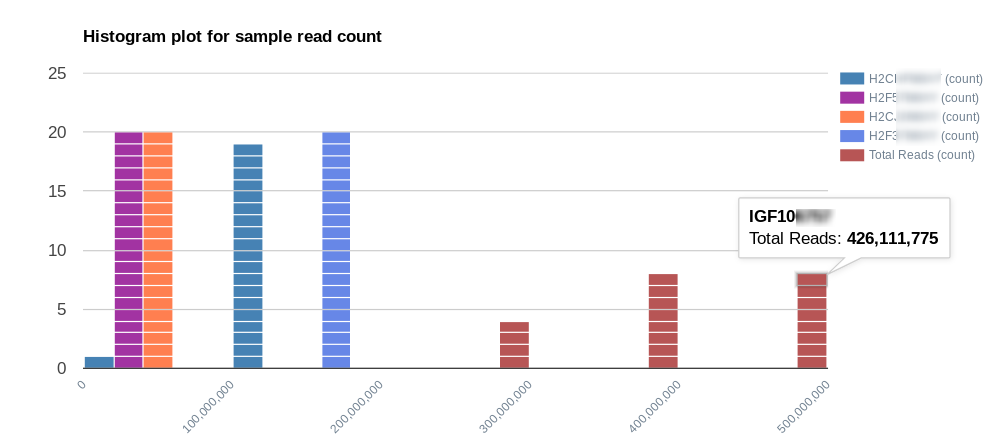
Project with multiple sequencing runs (histogram plot)
This is similar to the plot description of Project with single sequencing run (histogram plot). Same as the column plot described above, this view combines data for multiple samples for multiple sequencing runs. This plot is designed for projects where all (or majority) of the samples are part of more than one (or all) sequencing runs.
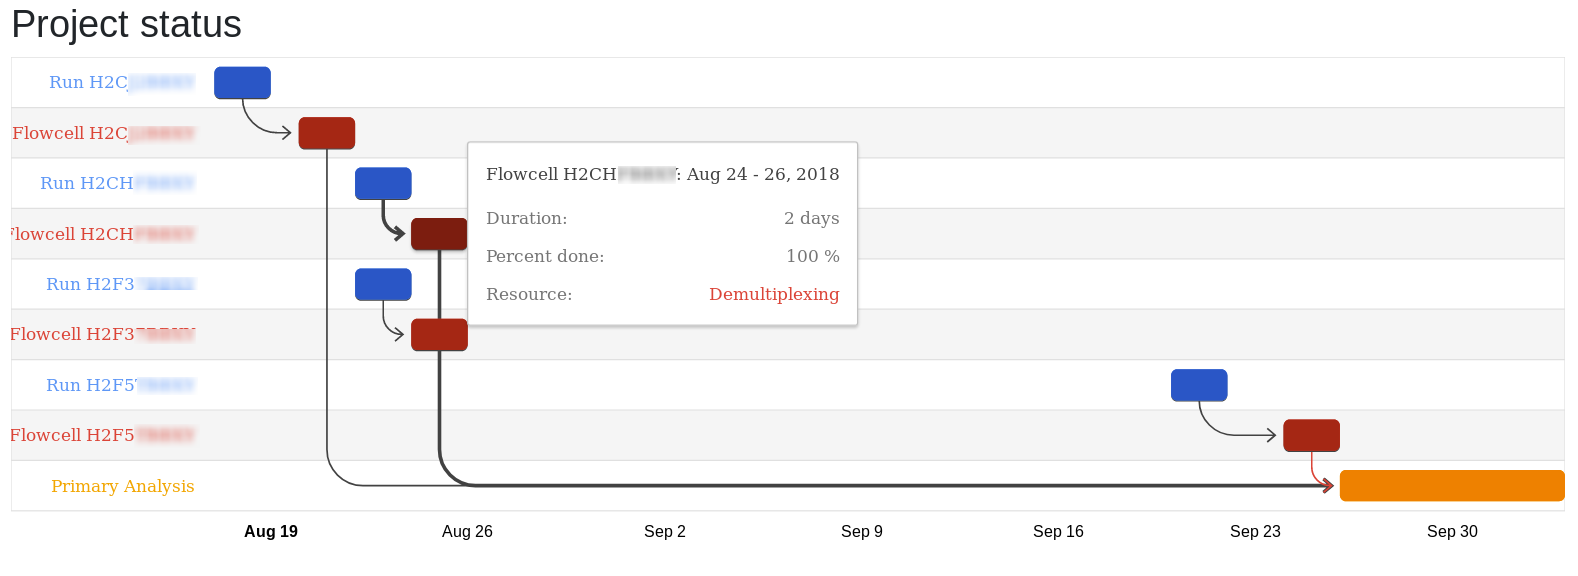
Project status
Click on the ‘Status’ link of the left side menu from the ‘Project Home’ page to track the demultiplexing or primary analysis for a project.
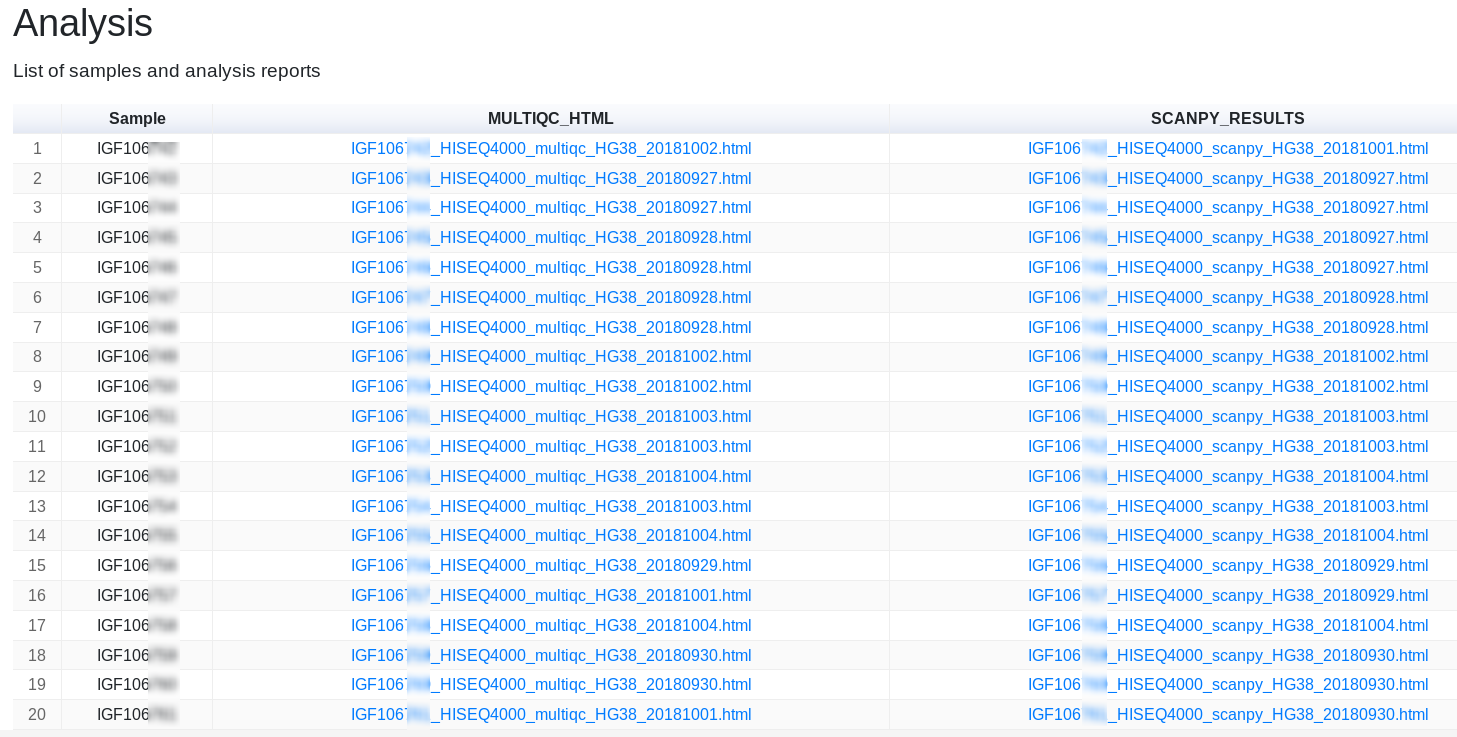
Analysis reports
Click on the ‘Analysis’ link of the left side menu from the ‘Project Home’ page to access this page. Analysis report page lists all the individual sample level QC reports for a project.
Run home
Navigate to Run home
Click on the list of sequencing runs from the ‘Project Home’ to access this page.
Alternatively, select ‘Run Home’ tab from top level menu to access this page, if you are already in any lane level or sample level QC page.
This page has following two sections
- Project information: Detail about the sequencing run and project
- Fastq read QC: A table of lane level qc reports, for the run
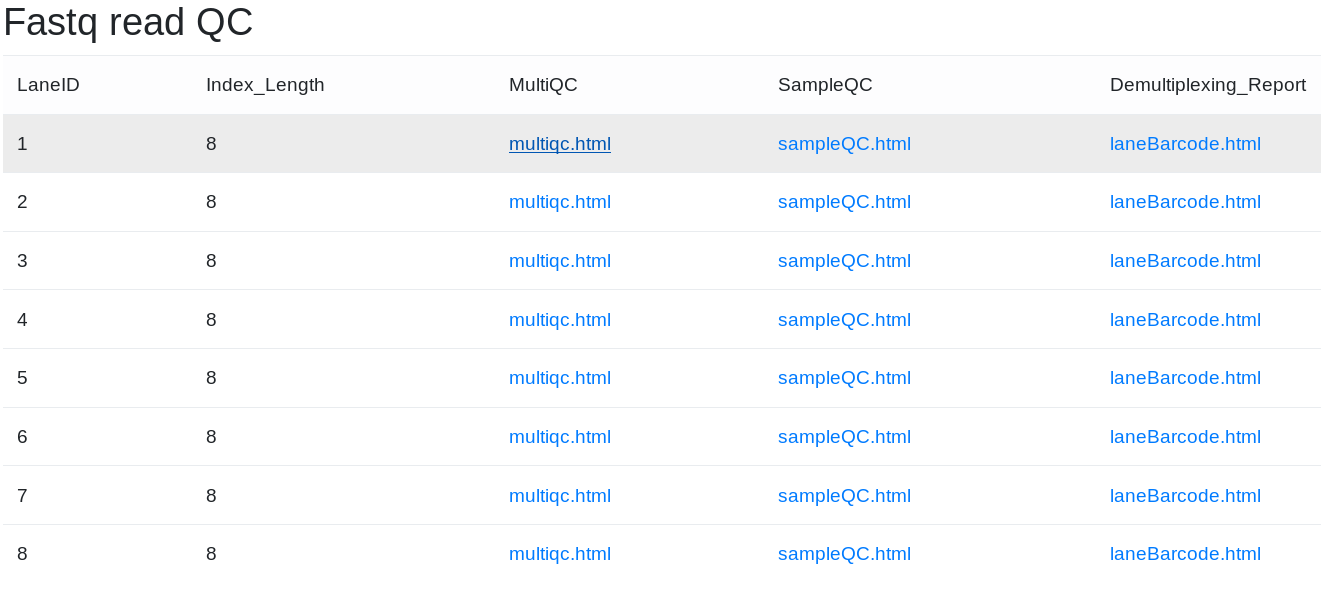
Lane level QC reports
This table of QC report for a specific run lists following information
- LaneID: Flowcell lane information
- Index_Length: Count of index bases
- MultiQC: Link to the MultiQC report page for the lane
- SampleQC: Link to the detailed sample level report page for the lane
- Demultiplexing_Report: Link to the demultiplexing report page for the lane
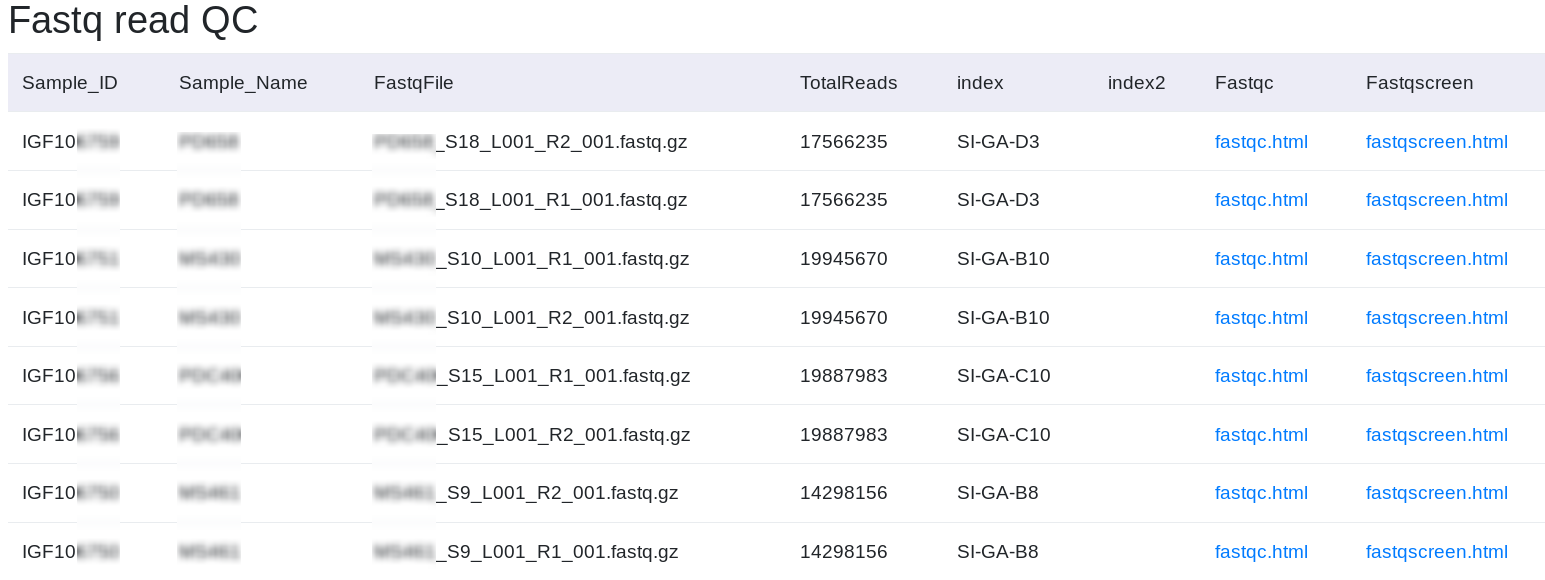
Sample level QC reports
Click on any of the ‘sampleQC.html’ links present on the lane level QC report section to access this page. This page lists following information
- Sample_ID: IGF sample id
- Sample_Name: User given sample id
- FastqFile: Name of the fastq file
- TotalReads: Total read count of the fastq file
- index: Index sequence 1
- index2: Index sequence 2 (for dual index runs)
- Fastqc: Link to the FastQC report page for the fastq file
- Fastqscreen: Link to the FastqScreen page for the fastq file
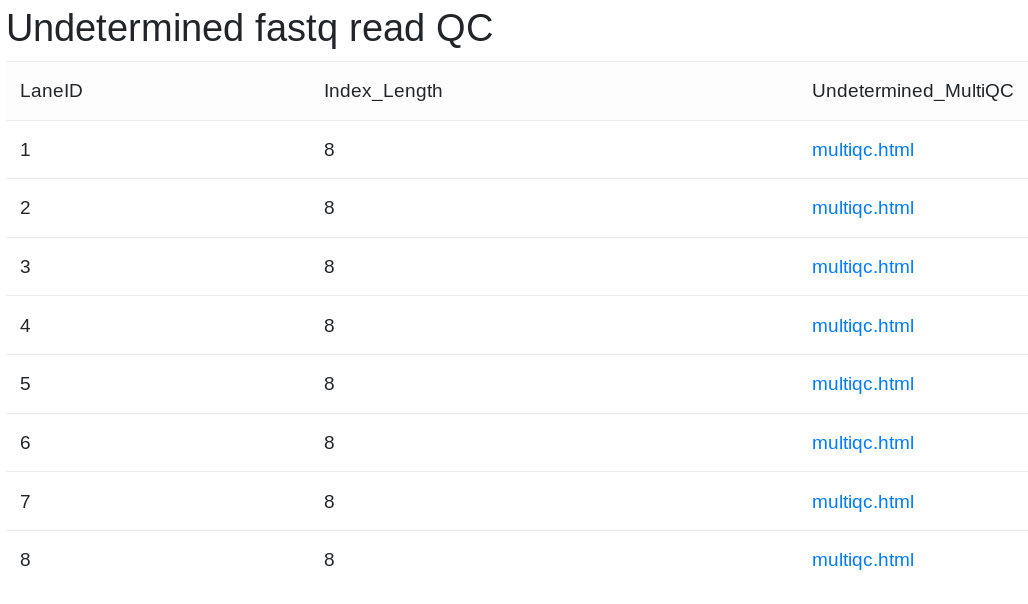
Undetermined reads
Illumina demultiplexing software mark any read as undetermined, if its fails to correctly assign the read to a known samples (known index barcodes). Apart for the QC of the know samples, we also generate the qc of these undetermined reads per lane.
Navigate to undetermined read qc page
Click on the ‘Undetermined reads’ tab from top level navigation menu, if you are in ‘Run Home’. Alternatively you have to move to ‘Run Home’ before you can access this page.
Lane level qc for undetermined reads
This page lists following information
- LaneID: Flowcell lane information
- Index_Length: Index sequence length (reported by Illumina software)
- Undetermined_MultiQC: MultiQC report for undetermined reads per lane
Change logs
- Project status and analysis information added on 21st August 2018
- Histogram plot added to project home on 27th July 2018
- Project home page added on 16th April 2018
- New QC report page added on 26th Feb 2018